K6
What is k6?
k6 is an open-source performance testing tool designed to help developers and QA engineers assess the performance and scalability of their applications. It offers a modern approach to load testing with a focus on simplicity and ease of use, making it a powerful choice for both small and large-scale performance tests.
There are couple of load testing tools present in the market, K6 is one of them which looks more promising in the field of modern performance testing, which not only provides the best in class developer experience but also it has robust code base maintained by multiple open source contributors.
Basic Concepts
- Test Script: A JavaScript file where you define your performance testing scenarios.
- Virtual Users (VUs): Simulated users that execute the defined scenarios.
- Options: Configuration settings for controlling test behavior, including thresholds, stages, and duration.
import http from "k6/http";
import { check, group, sleep } from "k6";
import { Rate } from "k6/metrics";

// A custom metric to track failure rates
var failureRate = new Rate("check_failure_rate");

export let options = {
  thresholds: {
    // We want the 95th percentile of all HTTP request durations to be less than 500ms
    "http_req_duration": ["p(95)<500"],
    // Requests with the staticAsset tag should finish even faster
    "http_req_duration{staticAsset:yes}": ["p(99)<250"],
    // Thresholds based on the custom metric we defined and use to track application failures
    "check_failure_rate": [
      // Global failure rate should be less than 1%
      "rate<0.01",
      // Abort the test early if it climbs over 5%
      { threshold: "rate<=0.05", abortOnFail: true },
    ],
  },
};

export default function () {
  let response = http.get("https://test.k6.io/");

    // check() returns false if any of the specified conditions fail
    let checkRes = check(response, {
        "http2 is used": (r) => r.proto === "HTTP/2.0",
        "status is 200": (r) => r.status === 200,
        "content is present": (r) => r.body.indexOf("Collection of simple web-pages suitable for load testing.") !== -1,
    });

    // We reverse the check() result since we want to count the failures
    failureRate.add(!checkRes);

    // Load static assets, all requests
    group("Static Assets", function () {
        // Execute multiple requests in parallel like a browser, to fetch some static resources
        let resps = http.batch([
            ["GET", "https://test.k6.io/static/css/site.css", null, { tags: { staticAsset: "yes" } }],
            ["GET", "https://test.k6.io/static/favicon.ico", null, { tags: { staticAsset: "yes" } }],
            ["GET", "https://test.k6.io/static/js/prisms.js", null, { tags: { staticAsset: "yes" } }],
        ]);
        // Combine check() call with failure tracking
        failureRate.add(!check(resps, {
            "status is 200": (r) => r[0].status === 200 && r[1].status === 200,
            "reused connection": (r) => r[0].timings.connecting == 0,
        }));
    });

    sleep(Math.random() * 3 + 2); // Random sleep between 2s and 5s
}
import http from "k6/http";
import { check, sleep } from "k6";

// `options.stages to configure ramp up/down VU level
export let options = {
  stages: [
    { duration: "30s", target: 20 },
    { duration: "1m30s", target: 10 },
    { duration: "20s", target: 0 },
  ]
}

// this defines the entry point for your VUs
// similar to the main() function in many other language

export default function() {
  let res = http.get("http://test.loadimpact.com");

  // check() function to verify status code, transaction time etc
  check(res, {
    "status was 200": (r) => r.status == 200,
    "transaction time OK": (r) => r.timings.duration < 200
  });
  sleep(1);
}
Distributed Testing
For large-scale tests, consider using k6 Cloud to run tests across multiple locations and simulate higher loads. You will need a k6 Cloud account to set this up.
Analyzing Results
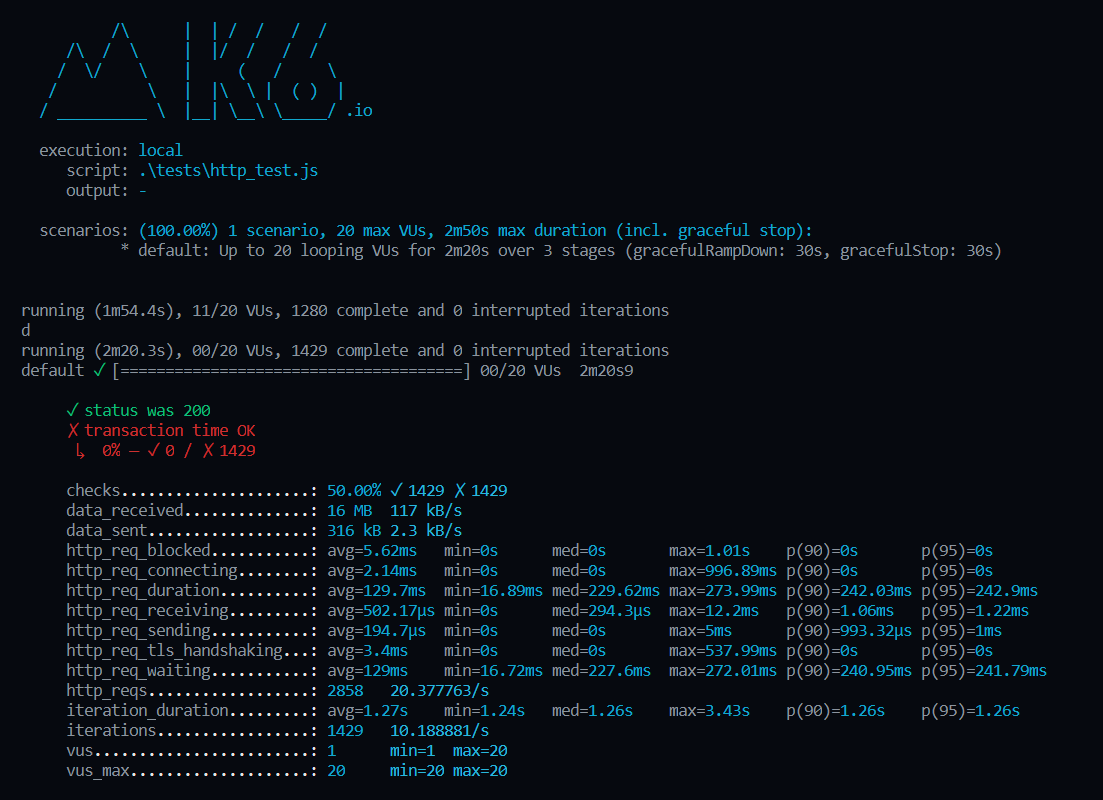
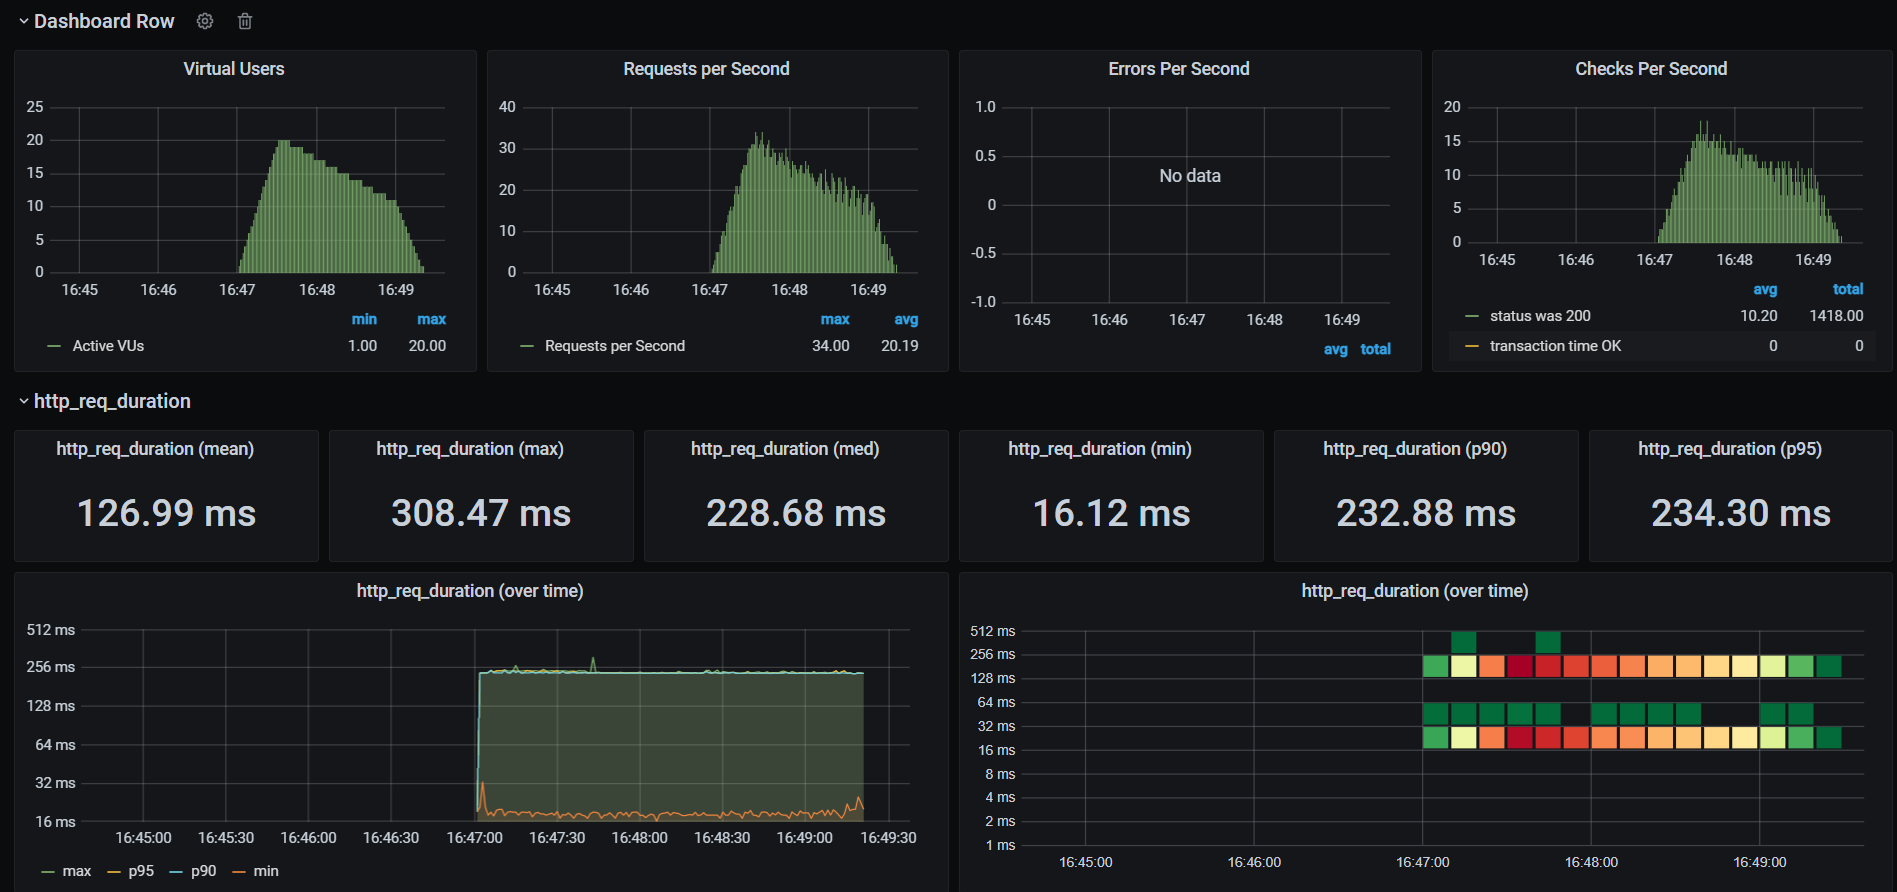
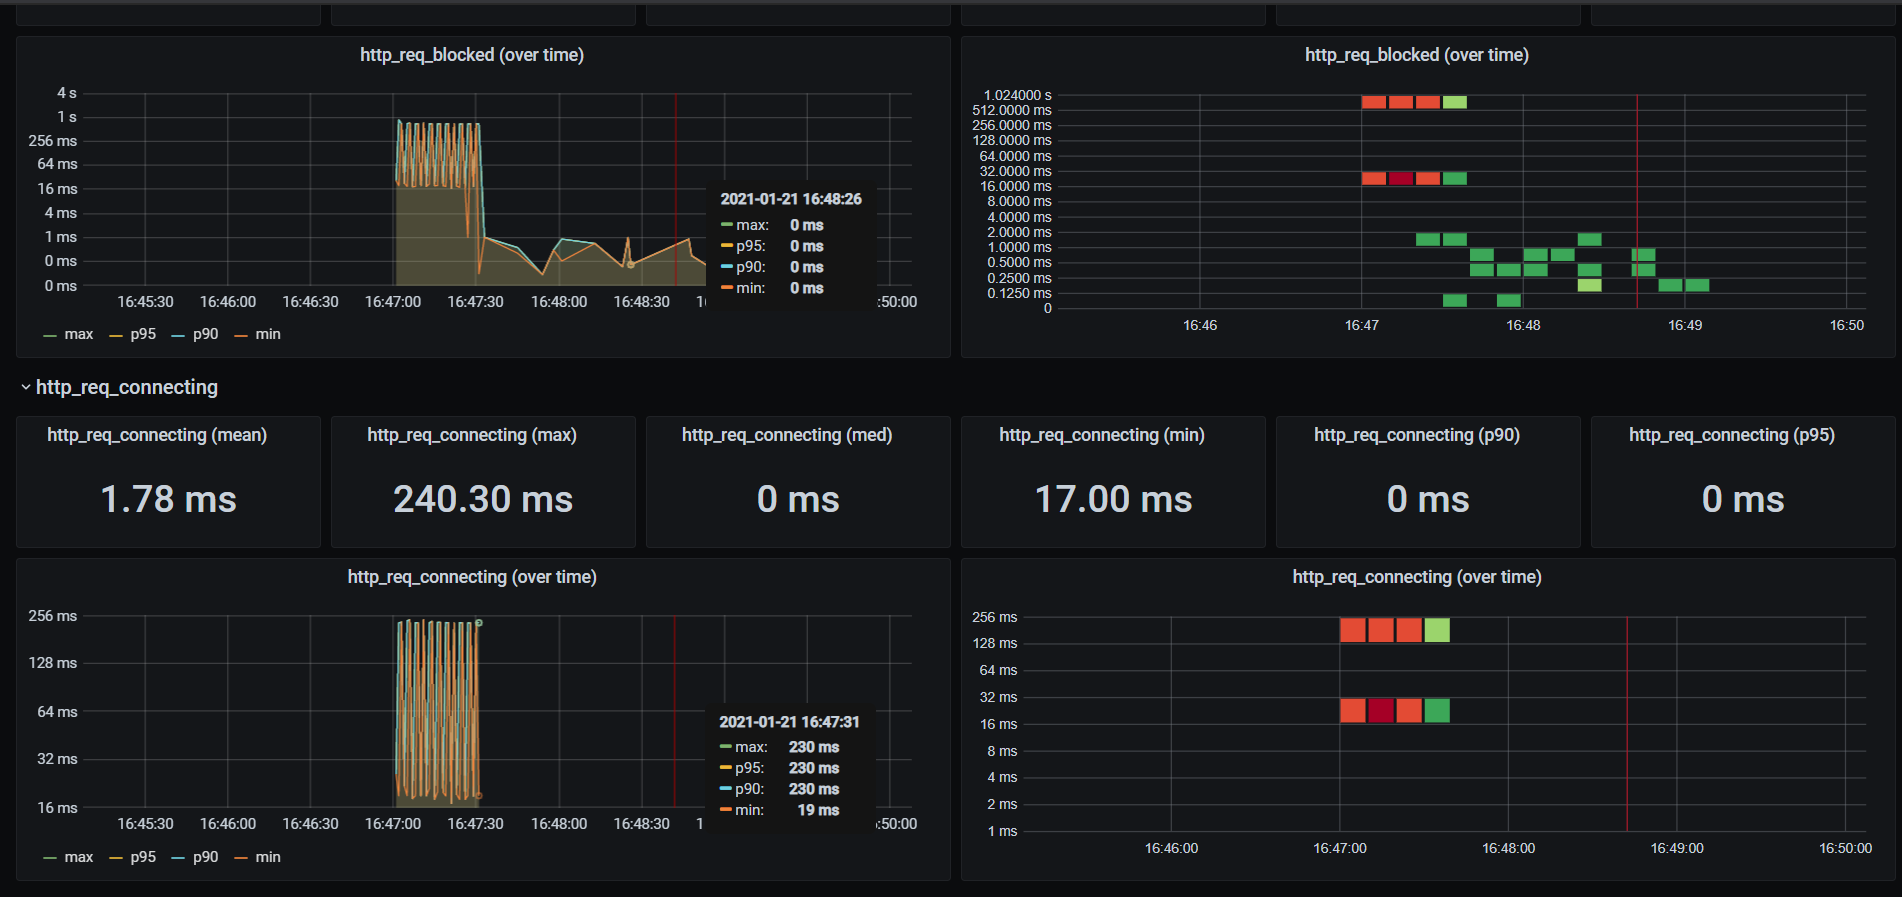
k6 provides detailed metrics and visualizations, including:
- Response Times: Average and percentile response times.
- Throughput: Requests per second or transactions per second.
- Error Rates: Percentage of failed requests. You can visualize results in real-time using the k6 dashboard or export them to other tools like Grafana for advanced analysis.
Best Practices
Define Realistic Scenarios: Ensure your scripts accurately represent real-world usage. Start Small: Begin with a lower load and increase gradually. Monitor Resources: Keep track of both client and server resources during tests. Analyze Thoroughly: Review results to identify performance bottlenecks and optimize accordingly. Automate: Integrate performance tests into your CI/CD pipeline for continuous testing.